|
|
|
|
|
|
|
|
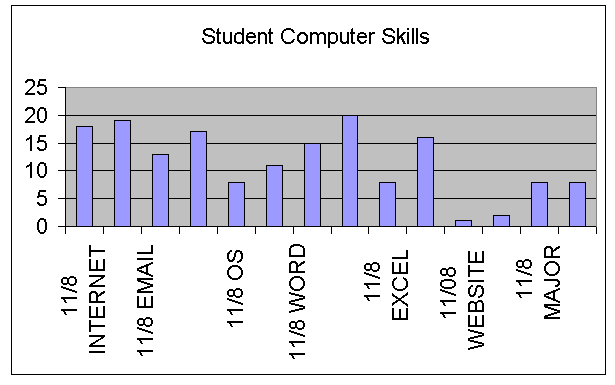
A Mathematical Class Portrait F, Meshelle Griffith, Antoine Hill, Lillian Jones, Mei Li, F M, Laura Miola, Jose Moscat, T P, Maria Elena Pedraza, Clara Preciado, Concepcion Preciado, Coral Rawlins, Joseph Rogers, Tracy Romain, Milca Santos, Amilton Semedo et al Introduction We, the students of the Community Learning Center’s Bridge Program, who have a GED or high school diploma, wanted to improve our skills before entering college next year. The data we present in this report compare our computer skills from November to January. Design of the Project On the first class on November 8, 2001, our math/computer teacher asked us about twenty questions concerning our backgrounds and our current computer skills. We answered all the questions and recorded them on a large chart as a part of the game. By mid-January, we had attended 15 hours of computer lab and had worked on many exercises, including opening e-mail accounts, writing our state legislators, and visiting several Web sites. As our Excel spreadsheet project, we took the answers from the game we had played in November, entered them into a spreadsheet, and learned how to make graphics from the data. When we analyzed our first graphs, we found that the results were not very exciting. We decided to concentrate on seven questions and to see how the answers had changed between November and January. The questions we chose were:
been added, so we decided to gather fresh data and record it directly onto an Excel spreadsheet. One student designed the data form while several others worked on the group essay. Once we collected new data from everyone who attended that night, we copied the data file to each of our diskettes, produced bar graphs, and computed the percent of increase for each of the seven questions. Results
Summary of Student Responses to Computer Skills Questions
As you can see from the above table and graph, our computer skills did improve significantly. Although our class showed a 100% increase in both our Excel and web design skills, we think it is important to note that increasing from one to two and from eight to sixteen both produce a 100% increase. This illustrates a shortcoming with percentages. If you contrast this with the 33% improvement in our Word skills, it looks as though we learned more about web design than we did about word processing. However, the reality of the situation is that more students learned Word than any other computer skill. Conclusion This project proved to be an efficient way to develop our math, computer, and writing skills. back to top |